SAFe Team and Technical Agility Assessment
Your Teams Say They're Agile. Are They?
Your team effectiveness, quality practices, and cross-team coordination determine whether delivery is predictable or a perpetual firefight. This assessment finds where that's working and where it isn't.


Where Team Capability Meets Delivery Reality
Most teams have adopted agile ceremonies. The gap between following a process and actually delivering predictably, with quality, as part of a coordinated release train — that's where the real problems hide. This assessment finds them.

What We Evaluate
Domains that shape Team and Technical Agility
- Agile Teams: How effectively your teams deliver value — from psychological safety and empowerment to backlog discipline, predictability, and continuous improvement of their ways of working.
- Built-in Quality: Your quality practices including pairing, peer review, collective ownership, early defect detection, and customer satisfaction through user feedback and root-cause problem solving.
- Team of Agile Teams: How your Agile Release Train coordinates across teams — from organisational alignment and PI Planning to cross-team integration, solution demos, and release-on-demand capability.
Proven Business Outcomes
Organisations that act on findings see movement in the areas that matter to their business:
Delivery Predictability
Teams consistently deliver on commitments each iteration. Stakeholders stop asking 'will it be done?' because the track record answers for itself.
Higher Quality
Fewer defects reach production because quality is built in — through pairing, peer review, and early detection — not tested in at the end.
Cross-Team Alignment
PI Planning and ART sync events create genuine alignment. Dependencies are visible, managed, and resolved before they block delivery.
Faster Time-to-Market
Continuous cross-team integration and incremental solution development mean value reaches customers sooner, not at the end of a big-bang release.
Team Empowerment
Self-organising teams with clear goals and psychological safety. Teams make decisions about how to do their work, not just execute instructions.
Sustainable Pace
High performance without burnout. Teams operate at a pace they can maintain, delivering consistently rather than sprinting to exhaustion.
Our Assessment Approach
Calibrated discovery, multi-lens analysis, diagnosis with direction
Step 1
We start with where you are, not where a framework says you should be.
We talk to the people who make investment decisions and the people who live with those decisions. Most organizations describe their process one way on paper and operate differently in practice. This is very common. We find out what’s actually happening.

Step 2
No two assessments measure the same things.
An organization where good ideas take nine months to get funded needs different measurement than one where everything gets approved but nothing finishes. We select what to measure based on your situation, then collect the numbers, the qualitative patterns, and the sentiment data.
Step 3
Findings without a next step are just an expensive mirror.
We identify the changes that will make the biggest difference. Every recommendation connects to the business outcomes your leadership cares about — revenue, cost, time to market, customer satisfaction — not framework compliance scores.
Comprehensive Reports
Engineering leaders don't need more metrics — they need someone to tell them what the patterns mean. Our reports give clear sight lines from current team performance to concrete next steps.
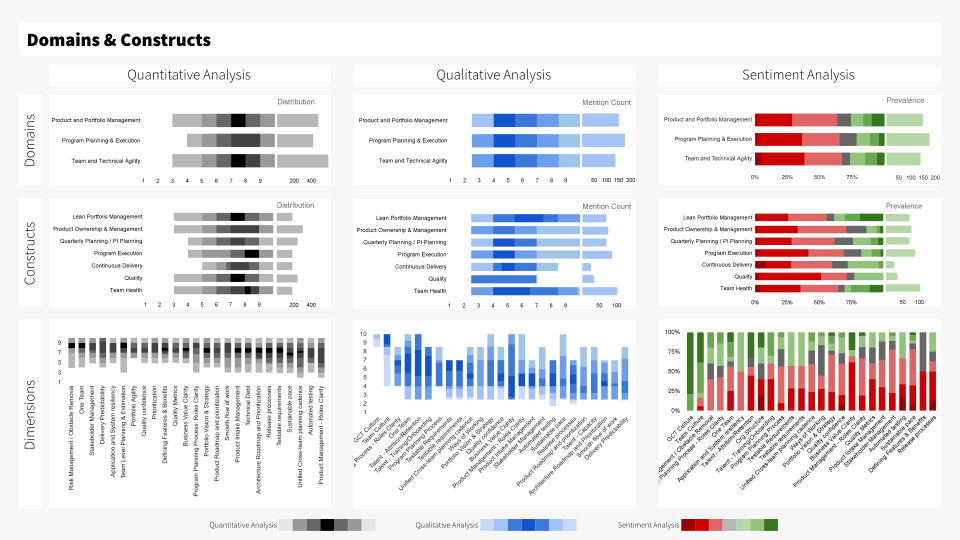
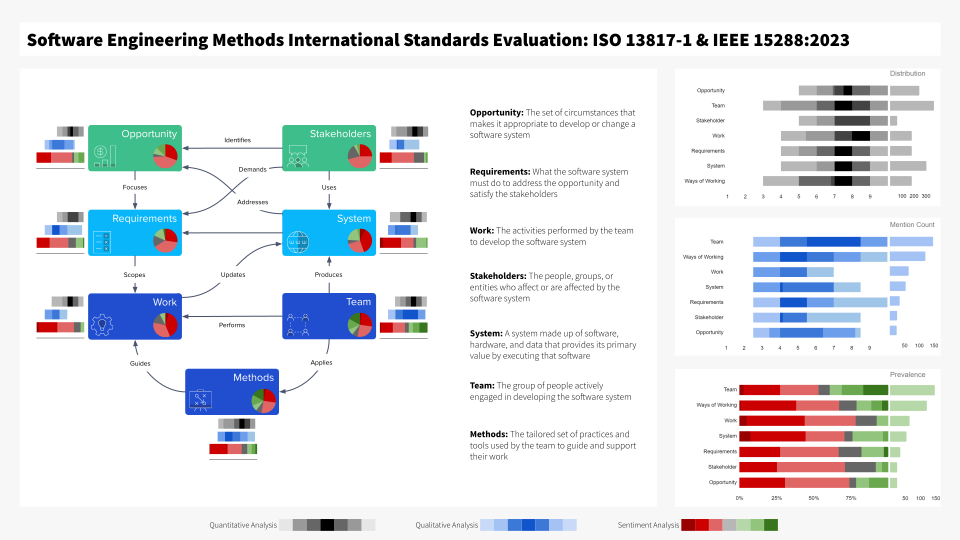
Quantitative, Qualitative and Sentiment Analysis
We combine metrics, context, and emotional indicators to give you a complete picture of your organization.
- The numbers: How long decisions take, how much work is in flight, where money goes, whether investments deliver what was expected.
- What your people say: Decision-making patterns, friction points, workarounds, and the things that numbers don’t capture. This is where the real picture emerges — people in the same room often don’t realize they disagree about how things work.
- How your people feel: Whether stakeholders trust the investment process, whether leaders feel they have authority to act, and whether teams believe their work connects to something that matters. Execution capability lives in confidence as much as in process.
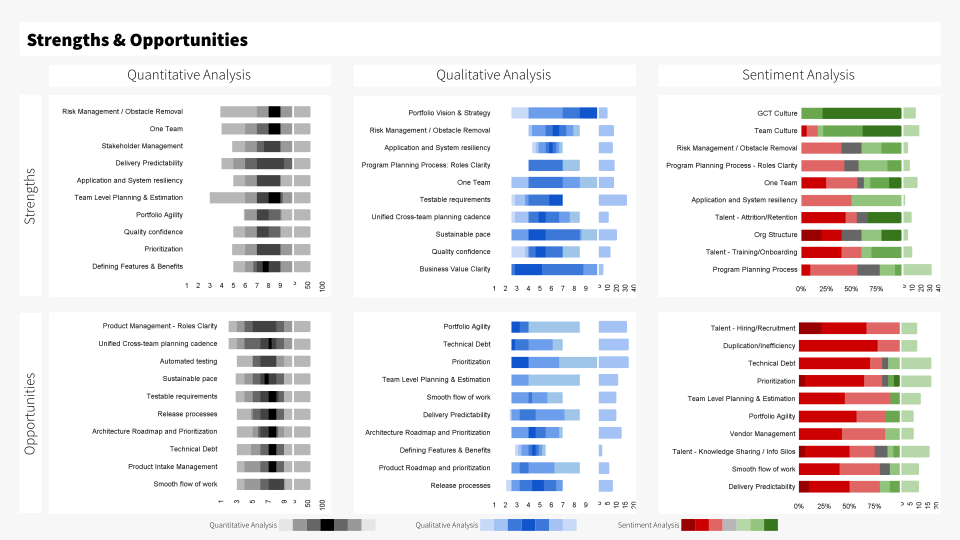
Strengths and Opportunities
We combine multiple analysis perspectives to show where you excel and where to improve.
- Strengths with specificity: Not “your teams are engaged” but “your operational leaders already make budget decisions informally — formalize that and you remove three layers of approval.”
- Opportunities mapped to actions: Each gap connects to a specific change — not a generic recommendation. “Reduce approval layers” with a clear mechanism, not “improve governance maturity.”
- Balance across domains: Where investment capability outpaces decision-making readiness (or vice versa), we surface the imbalance so you invest effort where it compounds.
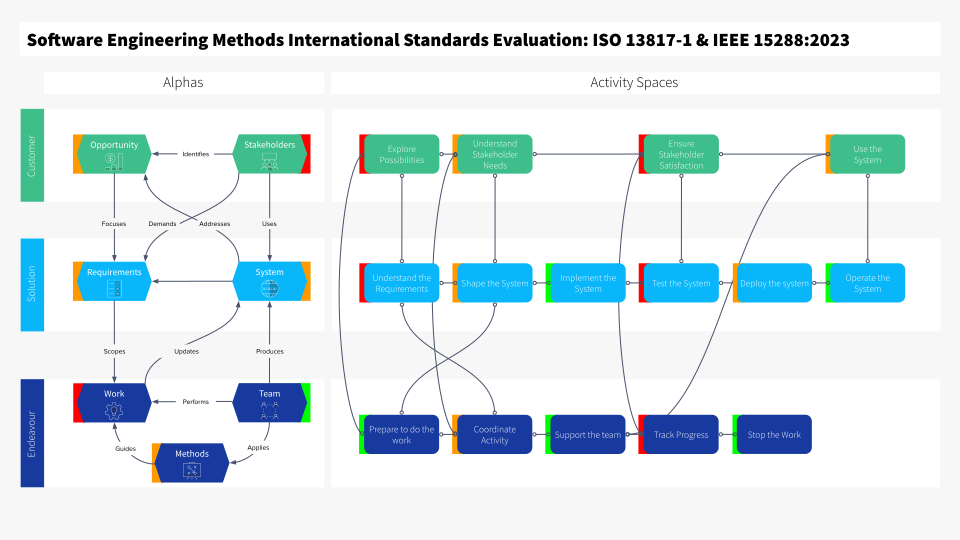
Software Engineering Methods
We assess your development practices through a universal lens that works across all methodologies and frameworks.
- Delivery capability: How effectively your teams translate funded initiatives into working products — whether they can actually deliver on the autonomy that faster investment decisions provide.
- Technical standards at scale: How architectural standards enable consistency across teams without creating bottlenecks — the technical counterpart to financial governance.
- Continuous delivery maturity: Whether your teams can validate investment hypotheses incrementally, or whether batch releases undermine the entire model of incremental funding.
Detailed Analysis
Beyond summary findings, we examine the structural patterns that determine whether team improvements last or revert.
Network Analysis
We map how your organizational capabilities connect and identify where focused improvements will have the greatest impact.
- Decision flow mapping: How investment decisions propagate — which people accelerate execution and which create queues. Most organizations discover two or three individuals who are bottlenecking decisions that should be made elsewhere.
- Cross-team dependencies: Where teams share platforms or markets, dependencies emerge that regular coordination meetings alone won’t resolve. We map interaction patterns to surface structural gaps.
- Strategic alignment flow: How strategic intent travels from leadership to execution — and where it degrades. If nobody can connect their current work to a strategic priority, the connection is broken.
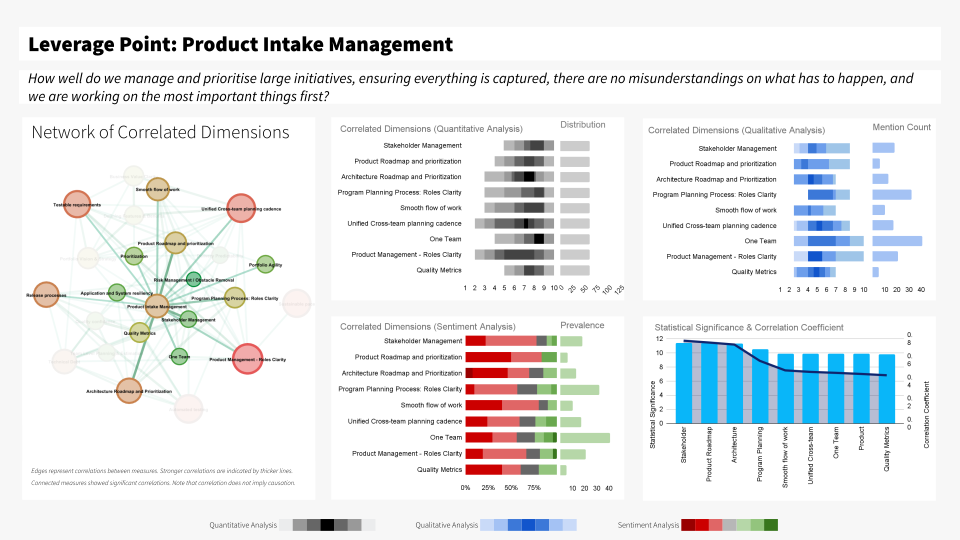
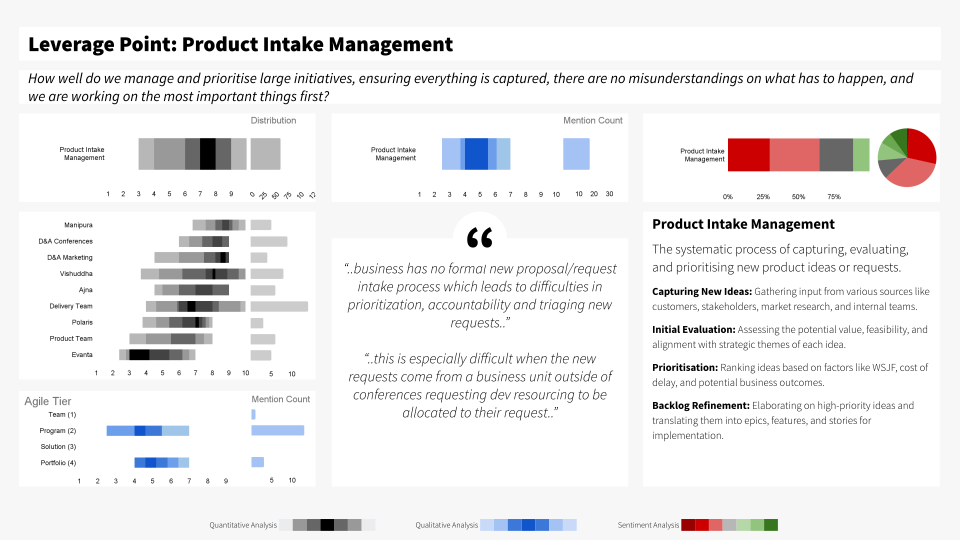
Leverage Point Analysis
We analyze how critical improvement areas affect different teams and roles.
- Highest-impact changes: The two or three interventions that produce cascading improvement — the investment policy change that unlocks three governance improvements, the capacity limit that clears the dependency backlog.
- What’s actually in the way: Slow approvals? Analysis paralysis? Cross-team coordination? Decision overhead? The real constraint determines what to fix first.
- Readiness-weighted prioritization: A correct improvement the organization can’t absorb creates resistance, not progress. We sequence by readiness, not just impact.
Change Roadmap
Diagnosis becomes direction. Everything from here translates findings into executable change — sequenced to build momentum, sized to minimise disruption, connected to the delivery outcomes your leadership defined at the start.
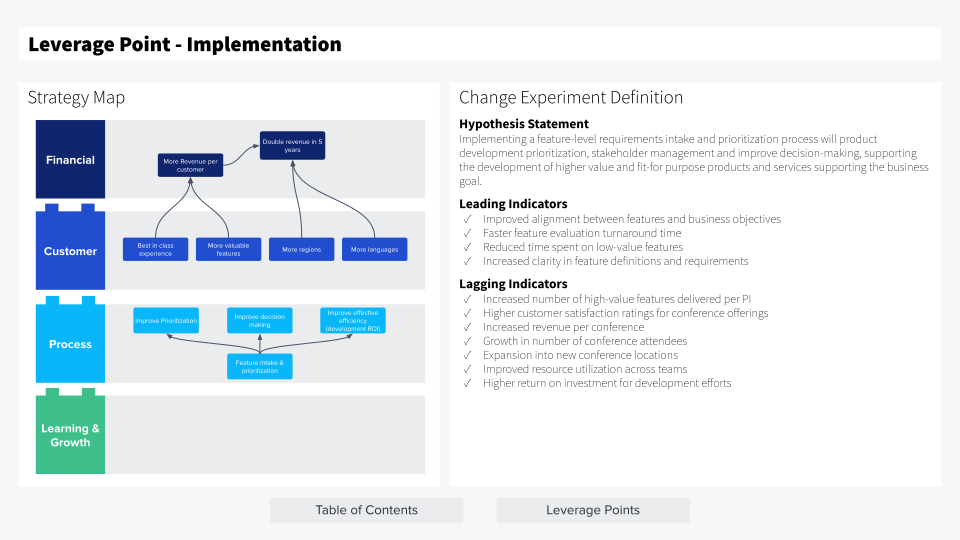
Change Backlog and Strategy Map
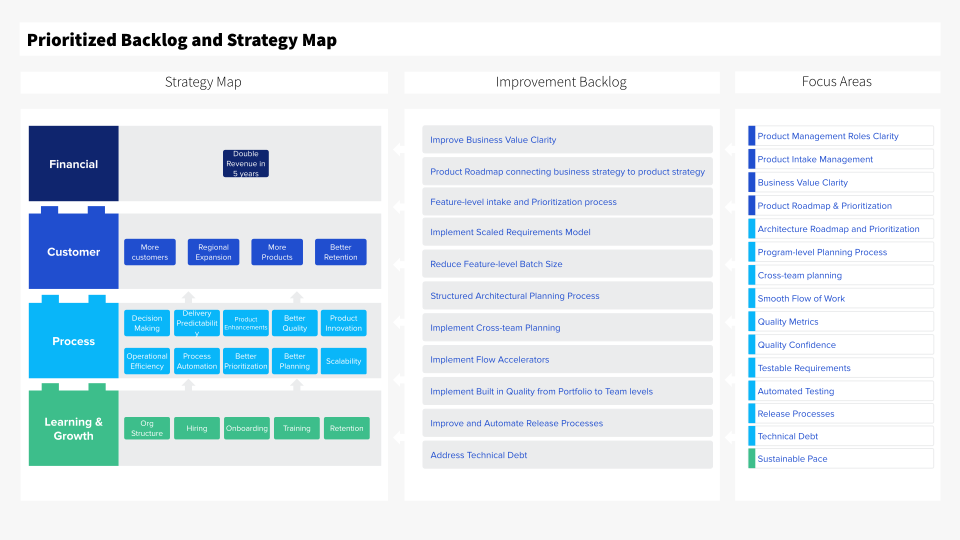
We identify each high-impact, low-effort leverage point and organize these points in a prioritized backlog that aligns with the business objectives defined in the strategy map.
- Change backlog: Findings converted into a prioritized list of improvement initiatives with clear acceptance criteria — managed with the same discipline we assessed.
- Strategy map: Visual linkage from what we found through what to change to what it delivers — making the reasoning behind every recommendation traceable to a business outcome.
Implementation Projects
We translate insights into targeted improvements that align with your business goals.
- Quick wins: Changes you can make within existing authority — decision boundaries, capacity limits, business case templates — demonstrating value in the first 30 days.
- Structural improvements: Investment model transitions, coordination redesign, PMO capability shifts — time-boxed with incremental validation.
- Capability development: Targeted skill building for the people who need to operate differently as a result of the changes.
Change Roadmap
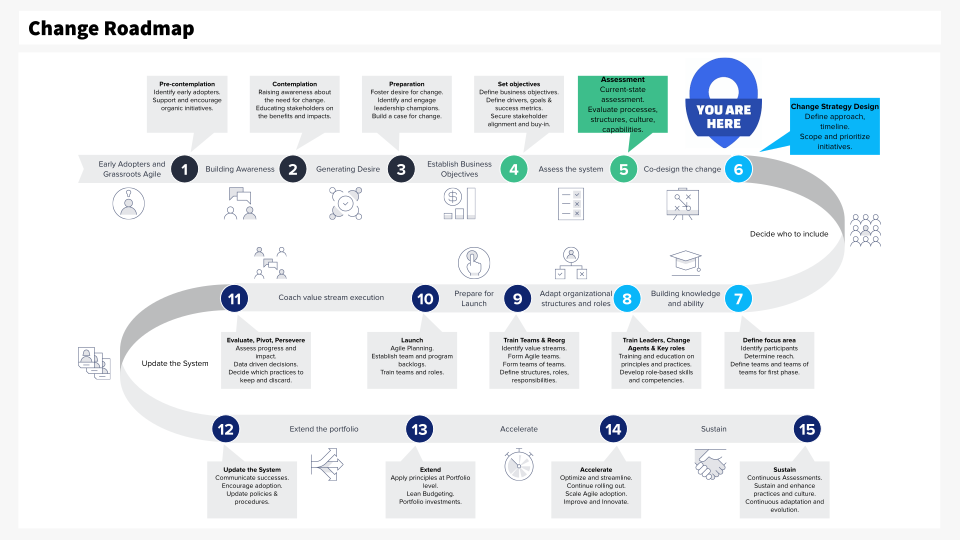
The Change Roadmap transforms our analytical insights into actionable initiatives.
- Sequenced for dependency and readiness: Investment changes precede governance redesign because decision boundaries need budget context. Coordination improvements precede performance metrics because you need the system before you measure it.
- Milestone-based validation: Not “implement Lean Budgets” but “operational leaders make three autonomous funding decisions within agreed boundaries this quarter.”
- Adaptive by design: Review at defined intervals, adjust sequence based on what the organization learns, move effort to where it produces results.
Minimal Disruption by Design
Our process fits into how your teams already operate — not a parallel workstream competing for sprint capacity.
Discovery
Runs alongside your normal cadence — we observe real meetings, not staged ones.
Data Collection
Integrates with your existing tools — we work with what you already capture.
Analysis
Delivers within weeks, not months — because conditions change and stale findings mislead.
Recommendations
Sized for your capacity to absorb change.
Executive Readout
A single session covers findings, highest-impact changes, and the proposed roadmap.
Self-Service Insights
Interactive reports let you explore data by team, dimension, or tier — on your schedule.
Industry Expertise and Certifications
Our practitioners hold SPC, Team Coaching, and Technical Agility credentials with direct experience guiding team transformations across financial services, technology, healthcare, and manufacturing.












Customer Testimonials
When one size doesn’t fit all: See how team assessment uncovered what retrospectives missed
Rachel Thornton, VP of Portfolio Management, Meridian Financial Services
We thought our investment model was modern because we’d stopped writing traditional business cases. The assessment showed us every team still queued for the same centralized approval — we’d changed the paperwork but not the decision structure.
David Okafor, CFO, Vantage Health Systems
The governance findings were uncomfortable but accurate. We had decision boundaries on paper and approval committees in practice. The assessment gave us the evidence to redesign around spending limits and return thresholds instead of approval chains.
Sarah Chen, Head of Operations, Atlas Technology Group
What set this apart was the work-in-progress analysis. No capacity limits, initiatives stuck in analysis for months, nobody could tell me our actual throughput. The analysis showed us which three changes would unlock the rest.
Marcus Lindqvist, SVP of Enterprise Strategy, Nordic Industrial Partners
Our strategic priorities existed in a deck nobody referenced when making investment decisions. The assessment mapped exactly where strategy-to-execution broke down and gave us a sequenced roadmap to fix it.
Faq
Common Concerns
Answers to the questions engineering leaders ask before engaging.
Retrospectives capture what the team is willing to surface. This assessment uses structured multi-source data to identify patterns the team may not see — especially cross-team coordination gaps and quality blind spots.
We frame it as a capability baseline, not a performance review. Responses are aggregated and anonymised. Teams see it as an investment in their effectiveness, not a judgment.
Health checks measure sentiment. This assessment measures practices, outcomes, and coordination against a structured framework. The output is specific enough to drive targeted improvement.
That’s exactly what the stratified analysis reveals. We show where teams diverge, why, and which improvements would have the greatest cross-team impact.
2-3 weeks. Data collection via a 15-minute survey per participant, followed by analysis and a comprehensive report with recommendations.
Contact our team to schedule a call. We’ll understand your specific team challenges, provide a customised proposal, and handle the implementation.